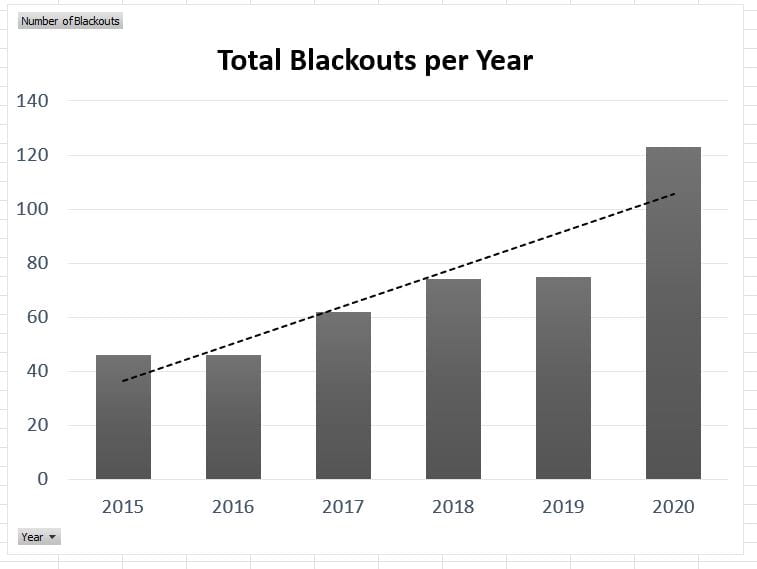
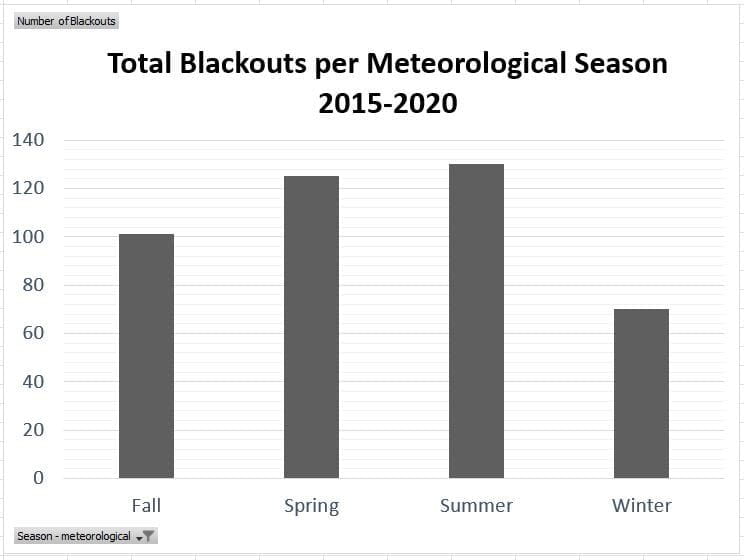
The Urban Climate Lab Blackout Tracker reports the monthly and annual frequency of electrical grid blackout events across the United States. The data comes from Electric Power Monthly reports, published by the U.S. Energy Information Administration (EIA). Our analysis finds a growing trend of major disturbances to utilities and resulting blackout events, which the EIA defines as a disruption that affects at least 50,000 people and lasts for at least 1 hour. The UCL Blackout Tracker will be continually updated with each new Electric Power Monthly report and extends a recently published analysis of blackout trends and heat wave impacts available here.
See below for the collected and cleaned data, or visit https://www.eia.gov/electricity/monthly/ to learn more about the source data.


| Month | Number of blackouts, 2015 - 2020 |
|---|---|
| January | 20 |
| February | 33 |
| March | 42 |
| April | 45 |
| May | 38 |
| June | 27 |
| July | 43 |
| August | 60 |
| September | 33 |
| October | 46 |
| November | 22 |
| December | 17 |
| Total | 426 |