• Skip to primary navigation
  • Skip to content
  • Skip to primary sidebar

Urban Climate Lab

  • Home
  • Team
  • Projects
    • Current Projects
      • 3HEAT Study
      • U.S. Blackout Tracker
      • Urban Heat + Health
      • Climate Justice + Compound Events
      • Urban Climate Modeling
      • Heat Risk Surveillance
    • Project Archive
  • Publications
  • Data + Resources
    • News Archive

Urban Heat + Health

Atlanta Climate Vulnerability Map

The Urban Climate Lab worked with the City of Atlanta to create a climate vulnerability map for all neighborhoods in the city — the first of its kind for a US city. Using the interactive map, residents can search for their neighborhood to see how it ranks in comparison to the other 247 neighborhoods in the city. Residents can also zoom down to the level of individual city blocks to see how their location compares to others in the city. Map colors correspond to the average daily high temperature in July (°F). Click on the button in the top right corner of the map to access the temperature range for each color class.

Climate risk statistics can be accessed by clicking on any neighborhood. All neighborhoods are ranked by heat risk, flood risk, and overall climate vulnerability (with lower numbers indicating higher risk). Additional statistics include the typical daily high temperature in July, the percentage of neighborhood homes with air conditioning, the neighborhood tree canopy coverage percentage, the number of trees needed to reach 50% tree canopy coverage (a goal adopted by the City Council), and how neighborhood heat risk would change if a goal of 50% tree canopy coverage was achieved.

Neighborhood statistics include the relative heat-related mortality of the neighborhood compared to the median mortality rate for the city. This metric is calculated as the percentage difference between the median mortality rate (deaths per 100,000 residents) for the city and that of the neighborhood of interest. Reported neighborhood statistics also include the heat island intensity experienced in the neighborhood. This metric is calculated as the difference in the maximum July temperature in the neighborhood minus the maximum July temperature in the coolest neighborhood in the city. For example, a heat island intensity of 6 would indicate that the average maximum temperature for the neighborhood is 6°F warmer than that of the coolest neighborhood. An overview of this climate risk resource can be found in the Atlanta-Journal Constitution.

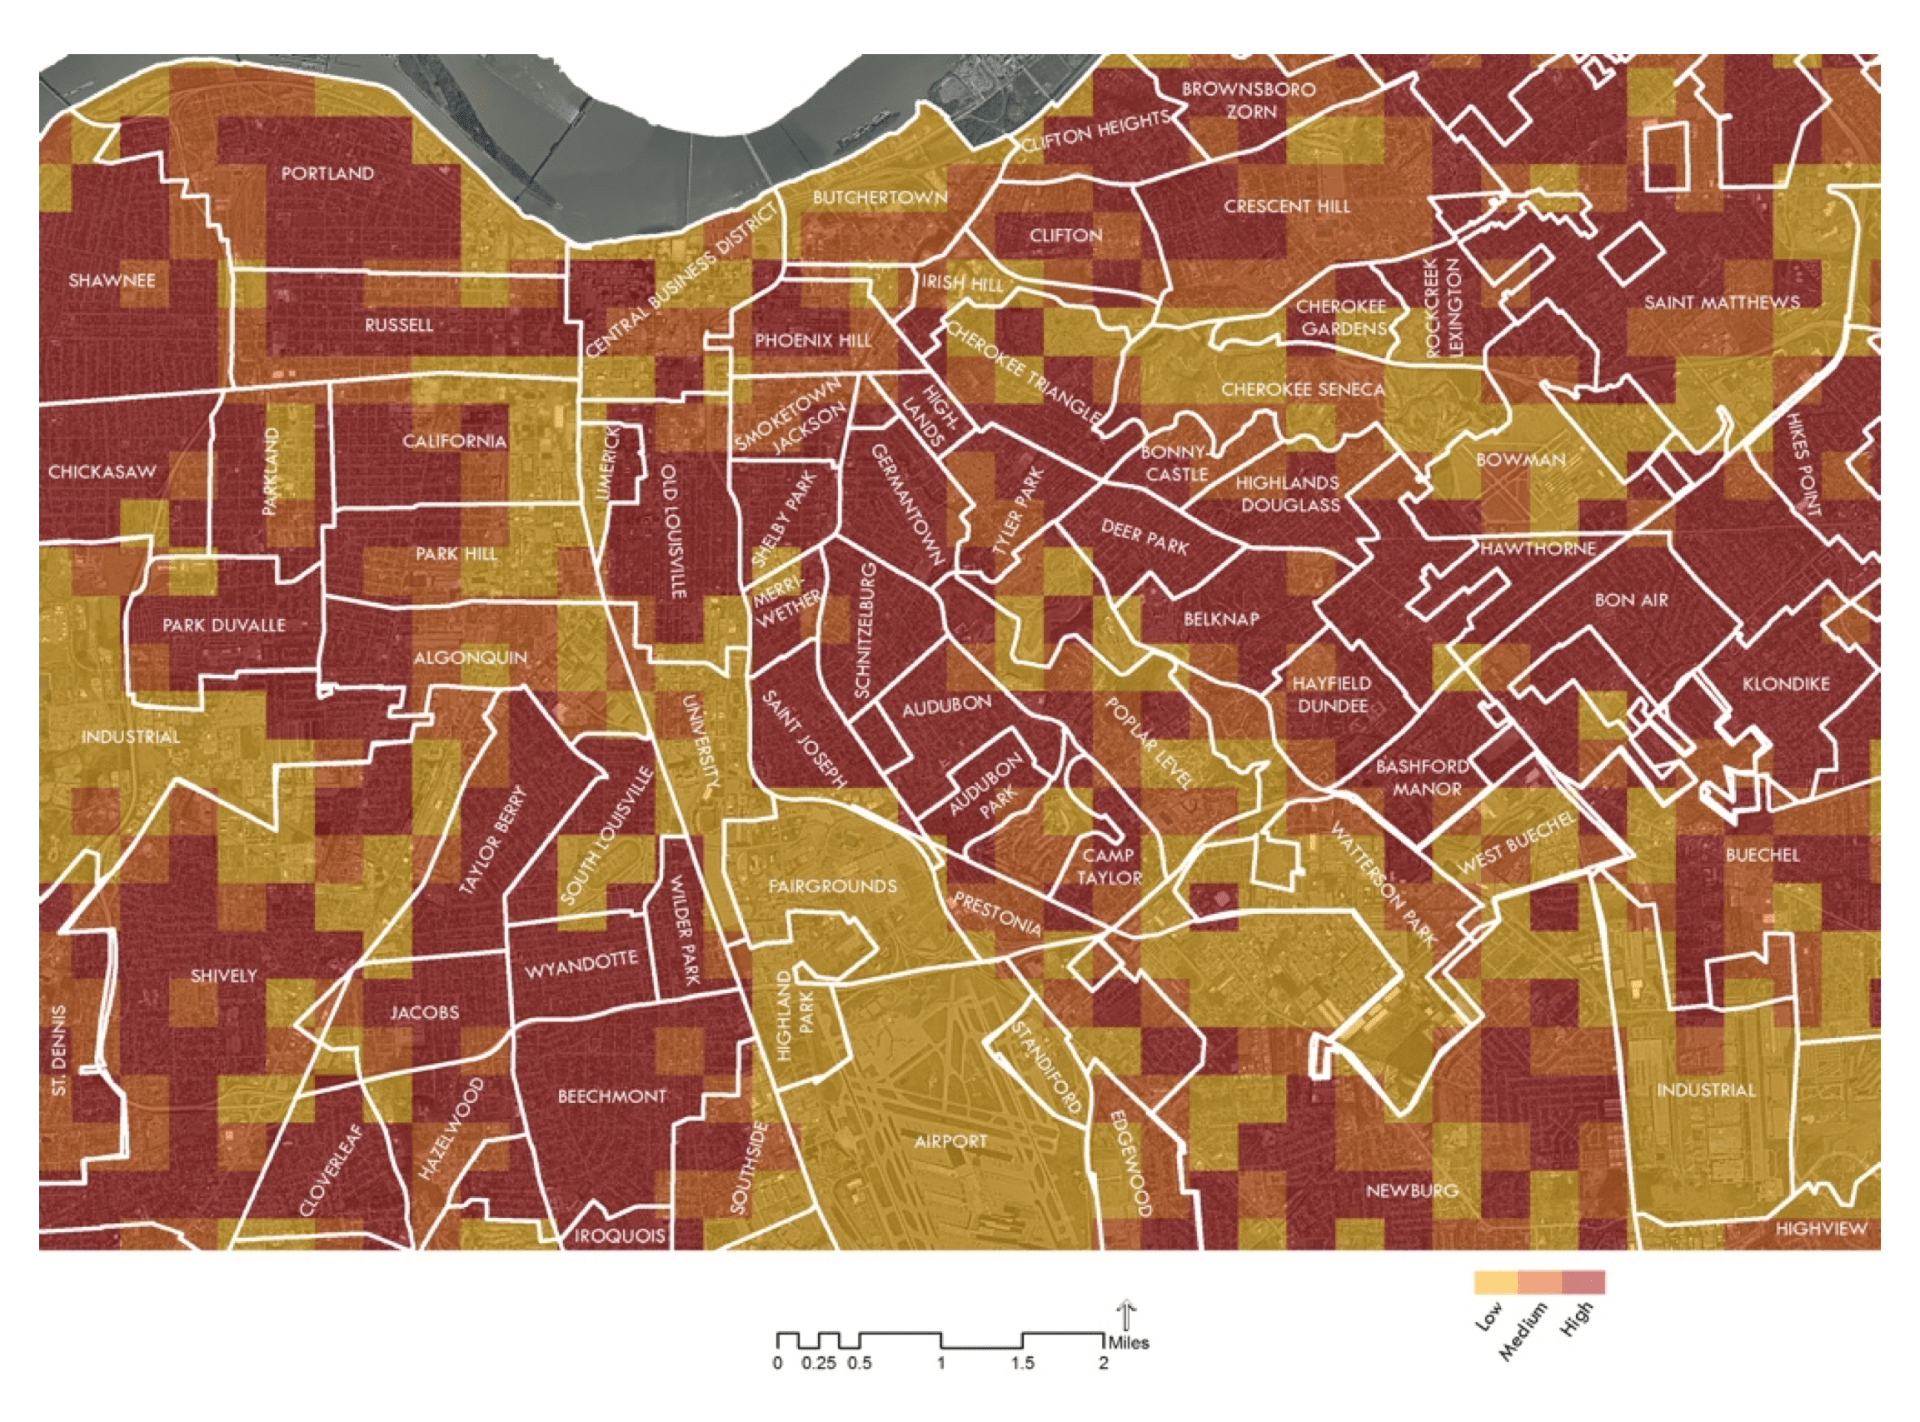
Louisville Heat Analysis

Exposure to extreme heat is the leading weather-related cause of death in the United States, with more than 10,000 Americans succumbing to heat exposure each year. The Urban Climate Lab is partnering with large cities to answer two questions related to a the rapidly increasing risk of heat. First, what neighborhoods are most at risk to heat illness? And, second, what climate adaptation strategies are most effective in reducing heat exposure and saving lives?

Through the use of high resolution urban climate modeling tools, the UCL can map heat risk at the neighborhood level. As illustrated in this map, both the level of heat exposure over the course of a hot summer and the resulting number of heat fatalities can be estimated for each urban neighborhood in Louisville, Kentucky – one of the most rapidly warming cities in the United States. Our work in Louisville and other large cities finds that the number of heat deaths each year could be substantially reduced through extensive tree planting and the use of reflective “cool” roofing on buildings. Our heat risk and health work has been featured in The New Yorker and The Guardian.

Reader Interactions

Primary Sidebar

Affiliations

Georgia Tech | College of Design | School of City and Regional Planning

Sponsors

National Science Foundation | National Institute of Health | US Forest Service

Stone's new book, Radical Adaptation: Transforming Cities for a Climate Changed World, is now available from Cambridge University Press. Read a book synopsis on Medium.

Recent News

Resilience or Recklessness? Discussion of retreat in Los Angeles on NPR

Radical Adaptation selected as a top urban planning book of 2024

Climate Grief of City Life_The Atlantic

Washington Post uses UCL study to estimate deaths during a Houston heat wave/blackout

Heat waves: Why your AC cannot save you anymore

The heat wave scenario that keeps climate scientists up at night

Stone delivers talk on Radical Adaptation at Carter Presidential Library

Retreat First, Then Adapt in Noema Magazine

Deadly Heat in the Workplace: UCL study cited in New York Times

Radical Adaptation featured on Radio Ecoshock Podcast

Radical Adaptation: Unlearning How to Plan a City

UCL releases Heat Tolerance Index for 2023

Stone featured in New York Times article on urban heat risk

Approaching the limits of climate viability in cites

UCL featured in New York Times article on rising Sunbelt heat risk

UCL Study on Blackout + Heat Wave Risk in New York Times

UCL Study on Blackout + Heat Wave Risk in Washington Post

UCL Study on Blackout + Heat Wave Risk in Wired Magazine

UCL Releases Study of Atlanta's Neighborhoods Most Vulnerable to Climate Change

Stone featured in PBS NOVA documentary: Weathering the Future

Louisville's plan to combat urban heat could take a century at its current pace -- NPR

Conversations with Cabrera: Climate Action

Georgians without air conditioning endure dangerous heat

How tech can help paint a clearer picture of extreme heat in Atlanta – WABE

Facing a sizzling summer, large parts of the U.S. risk blackouts, government agency warns - CBS News

UCL study featured on Last Week Tonight with John Oliver

Yang's Georgia Tech studio applies new analytics to reduce flood risk, increase resiliency in Tokyo

Mallen interviewed on Dense City podcast - "Lights Out: Climate Change and Infrastructure Risk

Hot Summer Nights Get Hotter, and More Dangerous - New York Times

Atlanta's heat wave and blackout risk in Atlanta Magazine

UCL work featured in the New York Times

UCL work featured in the Wall Street Journal

Heat hits people of color the hardest -- Washington Post

UCL study featured in New York Times

Stone on the Daily Show: Arizona in the Grip of Climate Change

Stone interviewed for New York Magazine story on adaptation

UCL study featured in the Atlantic

Recent Comments

    Archives

    Categories

    • No categories

    Meta

    • Log in
    • Entries RSS
    • Comments RSS
    • Sites@GeorgiaTech

    Copyright © 2025 · Maker Pro on Genesis Framework · WordPress · Log in